Global Warming is a Farce, But it would sure be great if it was true!!!
Whenever there is a hurricane, an earthquake an unexpected snowstorm or unseasonable temperatures then out come the Global Climate Change alarmists. But I can assure you that you should pay no more attention to them as you would to a salesman trying to sell you a sump pump for your attic!
First, notice they quit crying out "Global Warming?!" Because the globe was not warming. Sure, weather stations were reporting higher temperatures, but once we began to look as satellite readings and deep sea diving drones and collating the data, we discovered the dangerous man-made global warming was not happening!


Source data: arctic.atmos.uiuc.edu/cryosphere/timeseries.anom.1979-2008
Of course, this is only a record for the satellite era data back to about 1980, and just like the much ballyhooed record low of 2012, we have no hard data to tell us if this has happened before or not.
Here’s the current Cryosphere Today plot, note the steep rebound right after the summer minimum, something also noted in Sea Ice News Volume 3 Number 14 – Arctic refreeze fastest ever:
![seaice.recent.arctic[1]](https://lh3.googleusercontent.com/blogger_img_proxy/AEn0k_tNylwwz4Y0UbpHC7XU3c2-iFAKW48W-fgFZmTivKc4EwRWBwp5gbVsvzAIb4tBoxReE-BP0G3zSp18W8rN1sHGp7vaN3bHUHx064BJDjVRu9SrhjM5sLF8OFazTGHfMxkRdAEf2fGvCnhXLblZNot7s3WLllMHKaBpzE0=s0-d) Source: Cryosphere Today – Arctic Climate Research at the University of Illinois
The Arctic ocean is well filled with ice right now:
Source: Cryosphere Today – Arctic Climate Research at the University of Illinois
The Arctic ocean is well filled with ice right now:
First, notice they quit crying out "Global Warming?!" Because the globe was not warming. Sure, weather stations were reporting higher temperatures, but once we began to look as satellite readings and deep sea diving drones and collating the data, we discovered the dangerous man-made global warming was not happening!
A recent news story for general publication = http://www.dailymail.co.uk/news/article-2294560/The-great-green-1-The-hard-proof-finally-shows-global-warming-forecasts-costing-billions-WRONG-along.html
The Roy Spencer Blog = First his 2,000 year temperature
graph: http://www.drroyspencer.com/global-warming-background-articles/2000-years-of-global-temperatures/
…and his home page is http://www.drroyspencer.com/
Anthony Watts has a home page for climate news = http://wattsupwiththat.com/ It is the world’s most viewed
and awarded climate blog. Anthony and other authors post on it regularly.
The audit of North American weather stations home page is
here: http://www.surfacestations.org/ Global warming alarmists
have attacked this website continually so many of the pictures and reports are
not available at all times. An apparently orchestrated attempt to locate
temperature sensing gauges in inappropriate locations was discovered as
volunteers around the continent photographed and reported on local weather
stations. So they have a separate site with pictures of every audited weather
station, good or bad, at the surface station database page: http://gallery.surfacestations.org/main.php. A few
examples…Eastport, Maine has their weather sensor within two feet of an air
conditioner exhaust. Tahoe City has theirs next to the place the groundskeeper
burns trash, near a big tennis court! Presque Isle, Maine, has a rooftop
sensor which means, of course, it shows very artificially high temperatures on
warm and sunny days. Urbana, Ohio not only has their weather station at a
sewage treatment plant (tends to emit heat) but here is the full
description:
-
Sensor is attached to the building, just mere inches away from
brickwork
- Sensor is near windows, which radiate heat from heated interior rooms in winter
- Sensor is directly above effluent grates for waste-water, Waste-water is often warmer than the air many months of the year
- Sensor is between three buildings, restricting wind flow
- Sensor is between three buildings, acting as a corner reflector for infrared
- Several exhaust fans near sensor, even though one is disable, there are two more on the walls (silver domes)
- Air conditioner within 35 feet of sensor, enclosed area will tend to trap the exhaust air near sensor
- Sensor is directly over concrete slab
- Refrigeration unit nearby, exhausts air into the enclosed area
- Shadows of all buildings create a valley effect related to sunlight at certain times
- There are two nearby digester pools, which release heat and humidity in the sensor vicinity
- Heat and humidity plume over the site from digesters is often tens of degrees warmer than the air in the wintertime
Here is the Santa Rosa weather station – on the asphalt roof of the Santa
Rosa, California Press Democrat Davis building!!! Talk about a heat sink? The
person looking for the weather station said this: “In traveling around California and Nevada to look at
NOAA USHCN climate monitoring weather stations I've seen some odd things. I've
seen temperature sensors near asphalt and concrete, sensors placed within feet
of buildings and cars, sensors placed near air conditioner exhausts, and sensors
that had barbeque grills in the vicinity.
Last Friday June 6th, I
traveled to Santa Rosa, CA to the Press Democrat Newspaper, a wholly owned
subsidiary of the New York Times, which according to NOAA, has the climate
station of record for Santa Rosa. But nothing prepared me for what I was about
to find at the Santa Rosa Press Democrat.
When I arrived, I couldn't
locate the NOAA MMTS sensor anywhere around the building, but I did see a tower
on the roof of the building, and in the rear of the building they had a Davis
Vantage Pro2 weather station on a pole. I knew that wasn't the official climate
temperature sensor provided by NOAA. So, after doing a perimeter search twice, I
went inside to inquire within. Everything in the lobby said "go away". I guess
it was the bullet proof glass, and the cameras, and the security guard. After
getting a name of the person responsible for their weather page from the front
desk, I called on my cell phone, no answer.
Undeterred, I decided to
try looking outside again. It was then I noticed the 5 level parking garage
about a block north.
From the top of the parking
garage a quick scan with my binoculars located the NOAA MMTS temperature sensor.
It was there, about 8-10 feet above the roof, surrounded by a sea of air
conditioners and exhaust vents!
Here is what I saw from my
binoculars:” http://gallery.surfacestations.org/main.php?g2_itemId=11228

So it is no big shock that this station, like many others
in North America, began sending much higher temperatures after the Democrats
took over politically and had control over the location of the weather station,
eh?
The really interesting thing about all this is that the
National Weather Service had a habit of tossing out cooler reporting stations
and “estimating them” while depending primarily on stations in cities, where
they are so often located next to airport runways and on rooftops and in front
of air conditioner exhausts or parking lots and so on and so forth. When you
include Michael Mann’s faked “Hockey Stick Graph” scandal and the leaked emails
of IPCC and CRU officials agreeing to hide information so that global warming
would appear to be a big problem, then remarkably enough one sees a conspiracy
of all things!!!
The plan was for people like Al Gore and organizations like
the UN to present faked information that would scare people into agreeing to
limits on their energy use, radical changes in auto emissions standards, the
eventual destruction of the coal industry and lots of government money going to
“green energy” companies that were usually political cronies. There was a
Carbon Exchange set up in Chicago where companies would pay for the right to
emit greenhouse gasses (to be able to operate) and supposedly Carbon Offset
companies would plant trees to make up for the emissions. However, in some
cases they would clear third world forests and then plant new trees rather than
allow the locals to use the cleared land for crops! It was all a scheme to
enrich guys like Al Gore, who has a massive primary home that uses so much
energy it puts the lie to his so-called belief in global warming.
Al Gore had four houses in 2010 and here is the front part
of his primary residence:

Al Gore is like the guy who tells you scotch will kill you while sipping on a couple of fingers worth of Dewar's. The UN and the IPCC and the CRU knew they were lying to you!!!
Global Warming’s Blue Dress Moment? The CRU EMail Hack Scandal
Not only did the CRU scientists discuss ways to hide data and cover themselves, they and IPCC scientists tried to hide and manipulate other data sets. Oh, and of course the famous "Hockey Stick Graph", which was an attempt to trick the public into believing that our coastal cities would soon be flooded and disaster would hit the planet. In truth, when the climate warms then plants grow more and bigger and crops flourish, giving mankind more food for less money. We WANT global warming, if possible!!!

credit
If you notice the "Medieval Warming Period" lasted for hundreds of years? It was a time of plenty and allowed Vikings to set up farms and cattle ranches in Greenland and Nova Scotia, among other places and, in fact, Greenland actually WAS mainly green in those days. Digs in North America and Greenland have revealed the truth - Global Warming was great for mankind!
But despite all the evidence-spinners who are working overtime to convince you that mankind is dangerously effecting the environment? Remember a couple of things...
1) How often do meteorologists get long-range forecasts right? Unless they are making predictions for unusual areas (like Coastal California (which has a definite wet and dry season) you cannot depend on predictions a month in advance...and you know it!
2) Al Gore stated the North Pole icecap would be melted by 2012, in fact actually should now be gone!
Sea Ice News: Volume 4 #1 – Arctic Ice gain sets a new record
From the Nature abhors a vacuum department comes this note from RealScience showing that Arctic sea ice has made a stunning rebound since the record low recorded in the late summer of 2012.With a few weeks of growth still to occur, the Arctic has blown away the previous record for ice gain this winter. This is only the third winter in history when more than 10 million km² of new ice has formed.
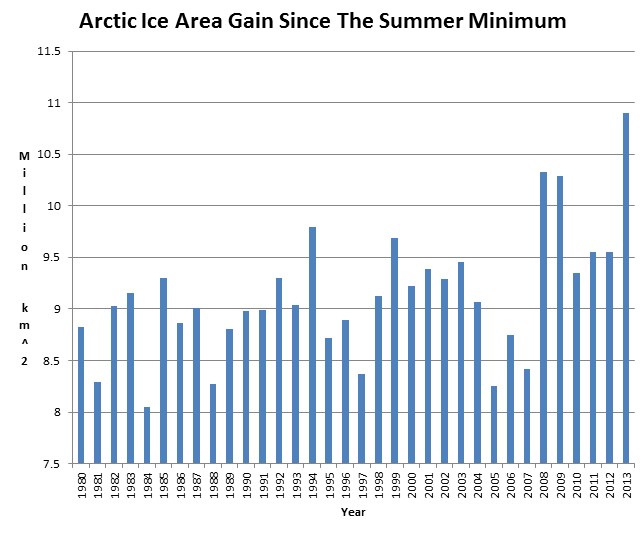
Source data: arctic.atmos.uiuc.edu/cryosphere/timeseries.anom.1979-2008
Of course, this is only a record for the satellite era data back to about 1980, and just like the much ballyhooed record low of 2012, we have no hard data to tell us if this has happened before or not.
Here’s the current Cryosphere Today plot, note the steep rebound right after the summer minimum, something also noted in Sea Ice News Volume 3 Number 14 – Arctic refreeze fastest ever:
![seaice.recent.arctic[1]](http://wattsupwiththat.files.wordpress.com/2013/02/seaice-recent-arctic1.png) Source: Cryosphere Today – Arctic Climate Research at the University of Illinois
Source: Cryosphere Today – Arctic Climate Research at the University of Illinois
In other news, the Antarctic seems to be continuing on its slow and steady rise, and is now approaching 450 days of uninterrupted above normal ice area according to this data: arctic.atmos.uiuc.edu/cryosphere/timeseries.south.anom.1979-2008…which shows the last time the Antarctic sea ice was below normal was 2011.8932 or 11/22/2011.
![seaice.recent.antarctic[1]](https://lh3.googleusercontent.com/blogger_img_proxy/AEn0k_tGZSLA1IDTvGpF9raUE5xKXaYe7RDkXVE6ikwGAM2vSkqkpWJ6MuhomTm5QlPwpnocH9SM6tQcdkW17bMVKHkOtWy8b46Lm5WZvvtdd0pWqEWNhB3oQdMWz7NepnZnTbQanGflcUSUq_HwECStKiSFPJohz0AlTK4PJkkI4sE=s0-d)
This continued growth of ice in theArctic Antarctic make the arguments for ice mass loss in Antarctica rather hard to believe, something also backed up by ICESAT data.
As always, you can see all the sea ice data at the WUWT Sea Ice Reference Page.
![cryo_latest[1]](http://wattsupwiththat.files.wordpress.com/2013/02/cryo_latest1.jpg)
![seaice.recent.antarctic[1]](http://wattsupwiththat.files.wordpress.com/2013/02/seaice-recent-antarctic1.png)
This continued growth of ice in the
As always, you can see all the sea ice data at the WUWT Sea Ice Reference Page.